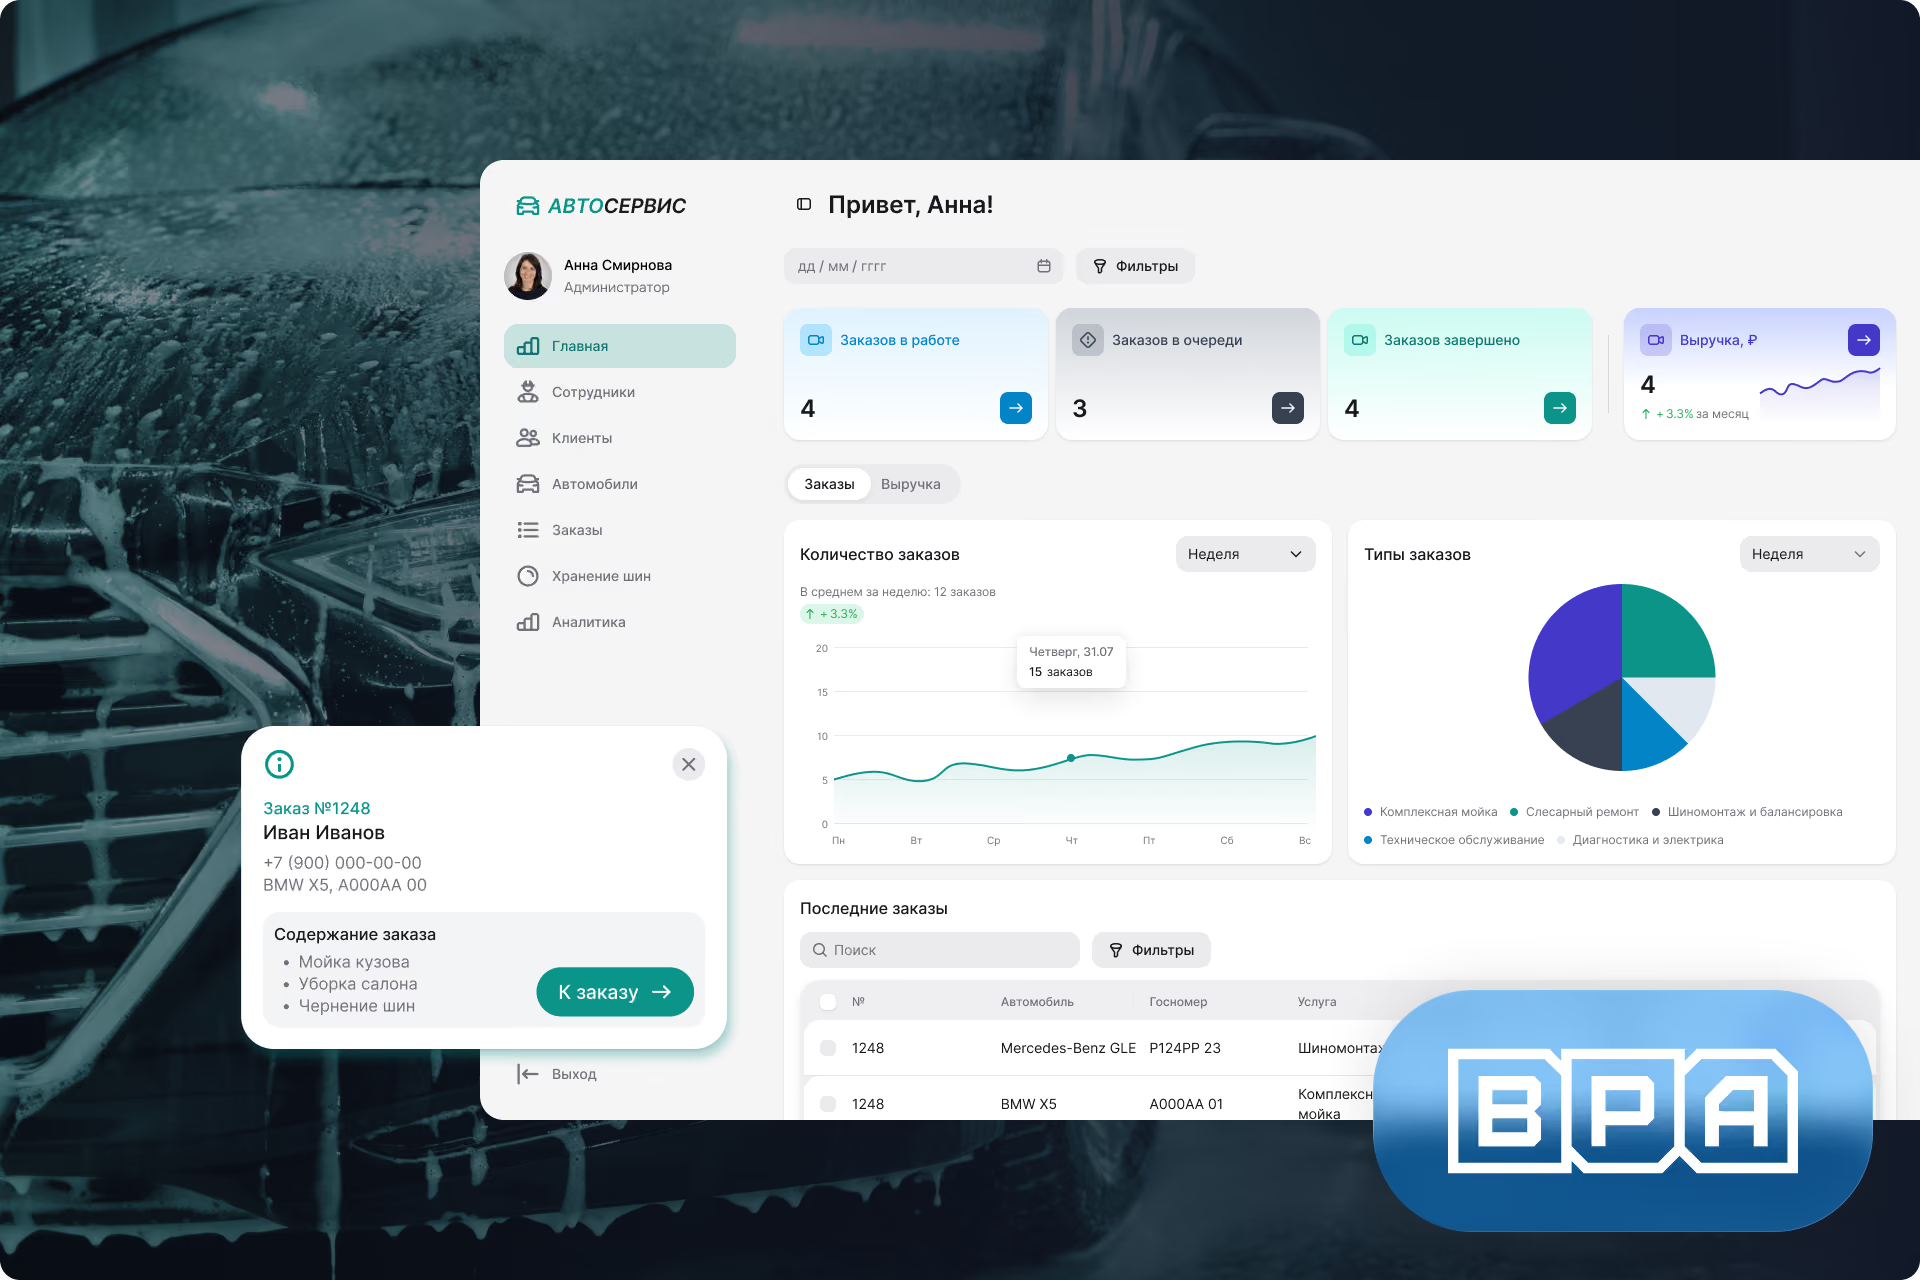
Development and implementation of BI systems for business

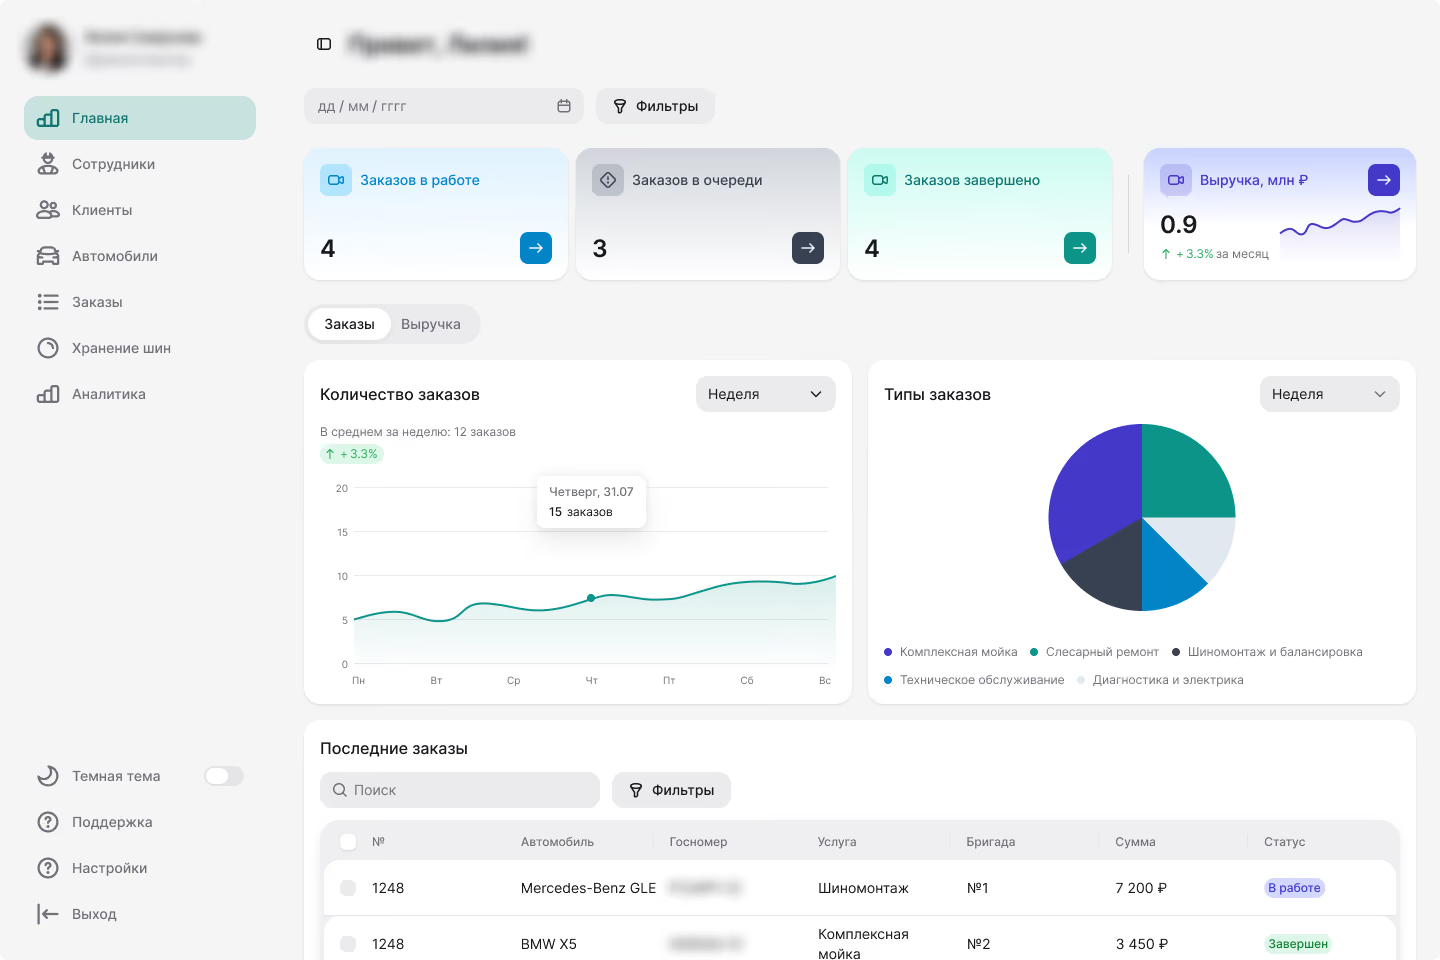
We build BI systems, management dashboards, and analytical platforms that unify company data into a single interface.

We automate data collection and reporting, configure performance metrics, and help managers gain real-time visibility into business health without the need for manual spreadsheet consolidation.
Benefits
Fast track — prototype in as little as 2 weeks
We start with your priority business task and real-world data. We connect primary sources, design key performance indicators, and create an initial interactive dashboard to quickly demonstrate the future BI system in action.
Full-cycle BI system development
We design and implement your BI system as a single team: we organize data workflows, build analytical models, and develop dashboards tailored to your management needs. As a result, you receive a fully functional BI solution that can be gradually expanded to include new metrics and departments.
Enterprise-ready infrastructure
We integrate the BI system into your company's existing IT environment, ensuring access control and connectivity with corporate data sources. The solution can be deployed within a closed network and scaled as your data volume, user count, and analytical requirements grow.
Trusted by
Risks mitigated by video analytics
Risks of abuse and unauthorized actions
Hidden resource losses
Lack of objective data
Invisible system deviations
Missed violations
Delayed incident response
Rising operational costs
Security and compliance risks
[ Project stages ]
What is included in BI system development
Data and reporting audit
We examine existing reports, spreadsheets, data sources, and user tasks. We analyze the data, identify discrepancies in metrics, and pinpoint which reports require automation.
Metric Methodology
We define the meaning of each metric, its calculation formula, source, and level of detail. This methodology establishes a unified foundation upon which BI analytics and management reporting are built.
BI System Architecture
We design the BI system architecture and the flow of data from sources to dashboards. We determine where data marts or storage are needed and how analytical updates will be organized.
Source Integration
We connect corporate systems, databases, and external services so that the business intelligence system automatically receives up-to-date information. We set up regular data collection and synchronization.
Data Preparation and Cleaning
We verify the structure, completeness, and quality of information before it is used in Business Intelligence. We configure data transformation and manage reference data, duplicates, and errors.
Data Mart Development
We create prepared datasets for specific analytical tasks. Data marts speed up BI system performance, simplify calculations, and ensure the origin of metrics is transparent.
Dashboard Design
We design dashboards tailored to real-world user scenarios. We carefully plan screen layouts, metric priorities, and data visualization to ensure analytics are easy to read without overwhelming the user.
Platform Development
We create dashboards, interactive reports, and analytical panels. We configure calculations, period comparisons, and drill-down capabilities to turn data analytics into a practical business tool.
Roles and Access Control
We configure access to data and dashboards based on user roles, departments, or specific entities. Managers and employees receive only the level of analytics necessary for their work.
Testing and Metric Verification
We reconcile BI system results with source reporting and control calculations. We verify the accuracy of metrics, filters, and data updates before the production launch.
Implementation and Training
We implement BI systems within the client's IT infrastructure, onboard users, and provide training. We help you transition from existing reporting to working with a new analytical platform.
Support and development
Post-launch, we continue to evolve your BI analytics by connecting new data sources, expanding metrics, and building dashboards to meet new management objectives.
Review my project   
The BI solutions we develop
Management
Management dashboards
We create executive dashboards that display key business indicators, trends, and variances. Users can quickly drill down from the big picture to the required level of detail.

Analytics
Analytical dashboards and reports
We develop analytical dashboards and interactive reports tailored to the needs of departments and management. We configure metric structures, filters, and data visualization.
Corporate analytics
Enterprise BI systems
We build BI systems that consolidate company data into a unified analytical environment, supporting various user roles.

Automation
Reporting automation
We replace manual file preparation with automated data and report updates. Automating reporting reduces routine tasks and accelerates access to real-time analytics.

AI
AI analytics and forecasting
We enhance BI systems with predictive models, anomaly detection, and intelligent data analysis. We help you identify patterns and forecast potential changes in your metrics.
Highload
HR analytics
We create analytical dashboards for key HR metrics and help you track changes essential for effective team management.
Geoanalytics
Geoanalytics
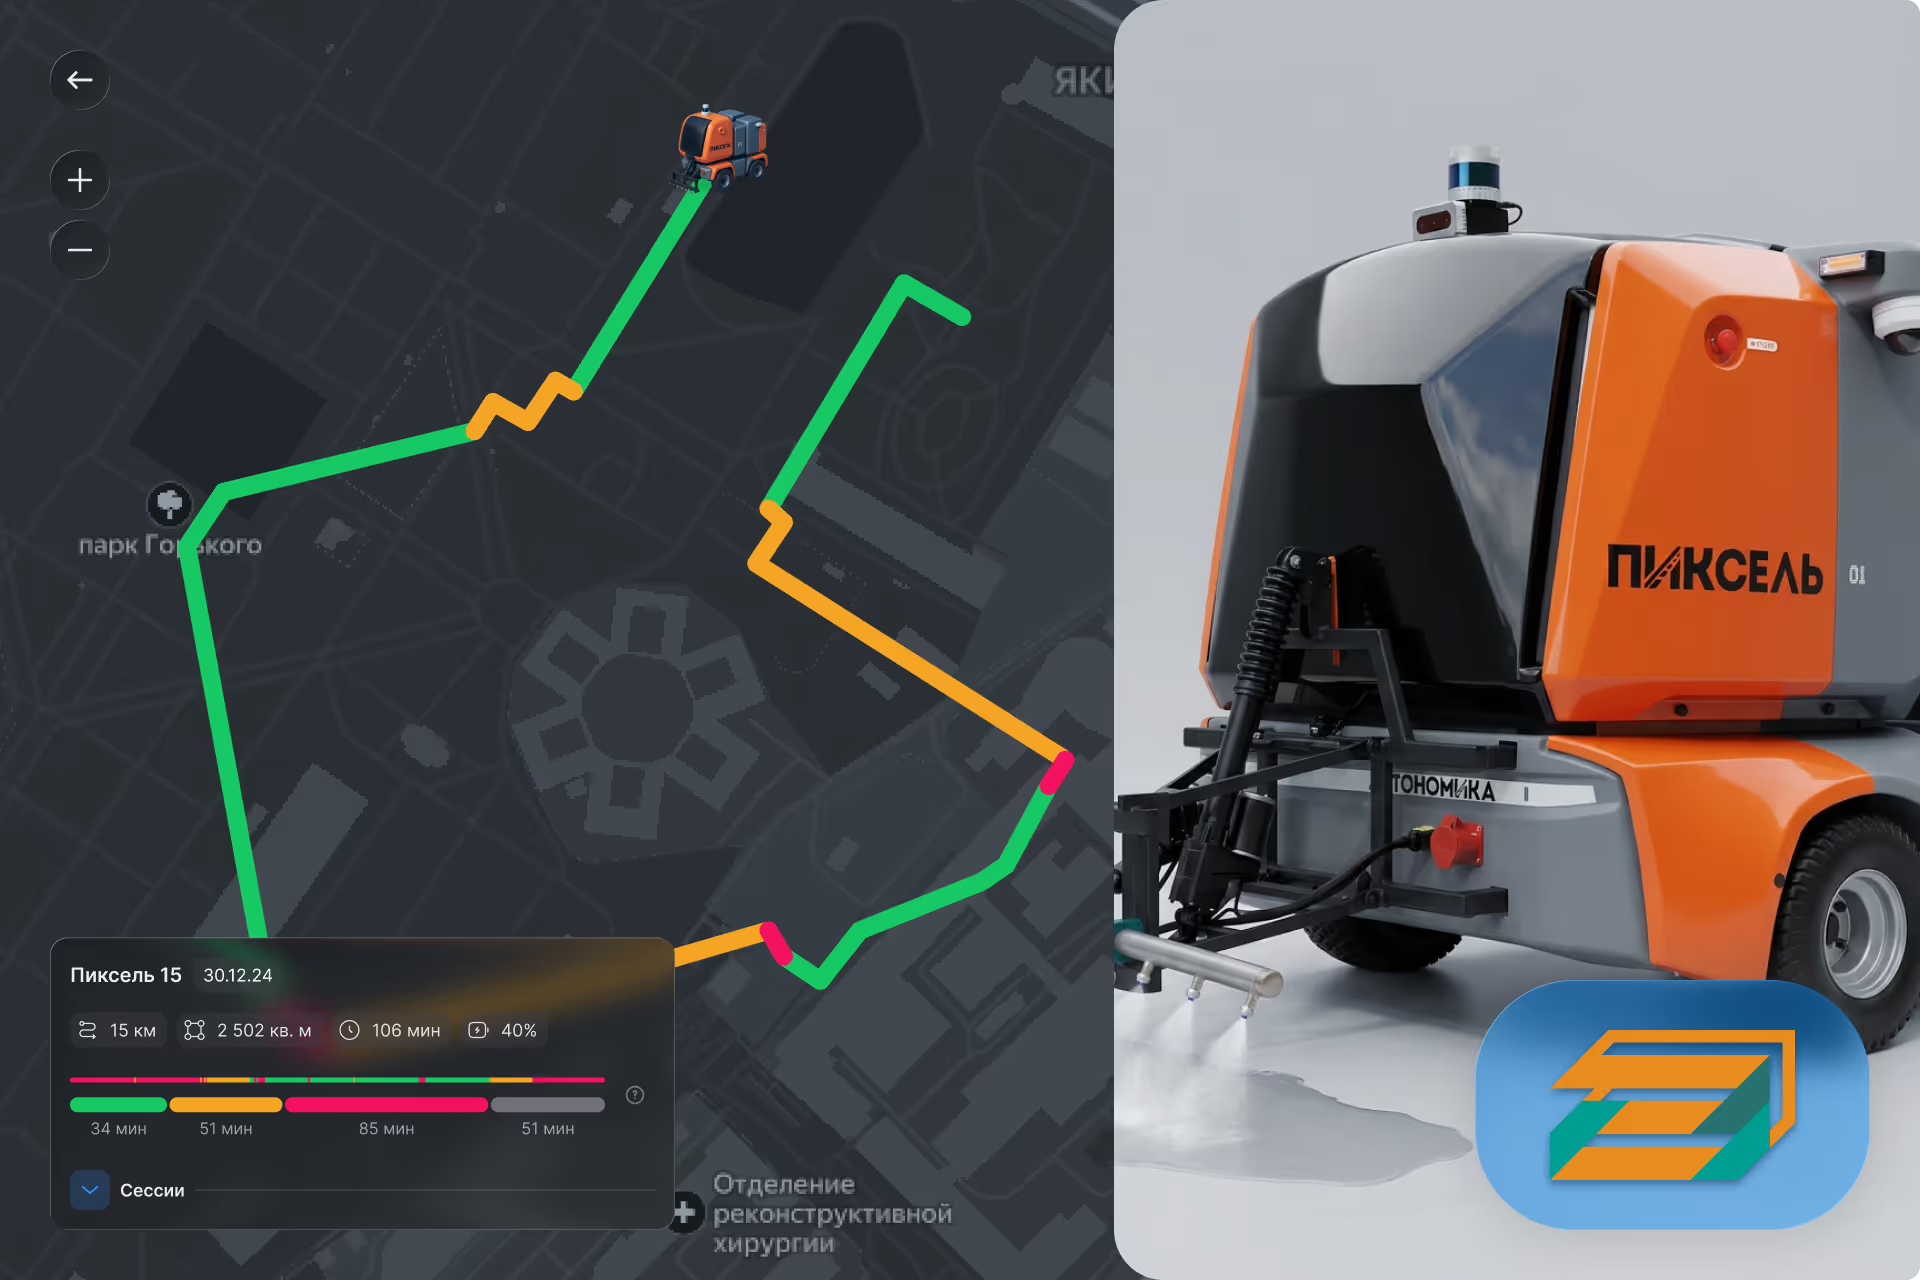
We display business metrics on a map and help you analyze results based on the geographical distribution of your data.
Audit
Migration from foreign BI platforms
We migrate analytics from foreign BI systems to Russian off-the-shelf or custom solutions. We preserve your logic, key performance indicators, and familiar user workflows.
Still have questions or didn't find the task you need? Reach out to us, and we'll take care of it!
What a BI system implementation brings to your business
A single version of the truth for the entire company
Stop wasting time arguing over whose report is correct. The BI system collects metrics based on a single set of rules, ensuring that management and departments are always working from one version of the truth.
An up-to-date business overview at any time
No need to wait for staff to prepare the next report. Management dashboards update automatically, giving you a clear picture of what is happening in your business right now.
From metric to root cause in an instant
If results change, you won't have to manually sift through multiple reports. BI analytics allow you to drill down from high-level metrics to granular details to quickly understand exactly what influenced the outcome.
Less manual reporting
Your team stops wasting hours on data exports, merging spreadsheets, and checking formulas. Automating reports frees employees from routine tasks, leaving more time for data analysis and driving results.
Spot deviations before they become problems
The BI system helps you immediately spot changes in trends and deviations from targets. Managers can respond to situations in real time rather than analyzing the causes after the period has already ended.
A BI system that grows with your business
You can start with a few key dashboards and gradually expand your analytics. New data, metrics, and departments can be integrated into the existing system without having to rebuild the entire solution.
Manufacturing and Industry
We integrate production and management data into a unified BI system. Dashboards help you monitor plan execution, capacity utilization, quality, and the efficiency of production processes.
Warehousing and Logistics
We build analytics to monitor warehouse and logistics operations. Our BI system provides visibility into inventory movement, resource utilization, timelines, and the root causes of supply chain disruptions.
Retail and FMCG
We consolidate data on sales, product range, and retail network performance. Analytical dashboards allow you to compare locations, categories, and time periods to quickly identify the factors driving your results.
Construction and Development
We develop BI systems to monitor facilities, timelines, budgets, and actual work progress. Management gains a unified view of projects and can identify risks of plan deviations more quickly.
Urban infrastructure and Smart City
BI analytics consolidate data on urban facilities and municipal services. Dashboards help monitor infrastructure status, maintenance work, and the quality of city services.
Transport and access control
We build analytical systems to monitor transport, facility utilization, and operational performance. Data from disparate systems is consolidated into a single management interface.
Airports, train stations, and transport hubs
Our BI system helps analyze zone utilization, service performance, and key service metrics. Management gets an up-to-date view of facility operations without the need for manual reporting.
Commercial real estate and offices
We consolidate data on facility operations, leasing, service requests, and expenses. Management dashboards help you compare properties and monitor operational efficiency.
Utilities and property management
We create BI analytics for service requests, project timelines, contractor performance, and facility status. The system helps identify problem areas and monitor the quality of property management services.
HoReCa and food service
Our BI system integrates commercial and operational metrics for your establishments. Analytics help you evaluate utilization, operational efficiency, and performance trends across your network.
Banking and financial sector
We develop BI systems for management, financial, and operational analytics. Our solutions can operate within a closed network and support complex role-based data access models.
Educational institutions and training complexes
We consolidate data on academic and administrative processes. Analytical dashboards help management monitor utilization, performance trends, and departmental operations.
Sports facilities and mass events
We build BI systems to analyze facility utilization, event management, and operational performance. Management gains unified analytics across all sites and key operational metrics.
Agro-industry
We consolidate data on production cycles, equipment, resources, and facilities. BI analytics helps compare performance across regions and identify deviations faster.
Medicine and pharmaceuticals
We develop analytical systems to monitor operational and management metrics. A BI system helps consolidate data from various departments and makes reporting more transparent and efficient.
Public sector and secure facilities
We develop information and analytical systems for monitoring metrics, facilities, and departmental activities. The solution can be deployed in a secure environment with access control and internal reporting.
Oil, gas, energy, and mining
We create BI systems for distributed facilities and complex industrial infrastructure. Analytics helps monitor operational performance, work progress, and asset status within a single framework.
Waste management and ecology
BI analytics allows you to monitor the movement of raw materials, facility utilization, and the execution of technological processes. Data is collected in a unified system for operational and management control.
We will review your project within 24 hours, suggest a clear starting format, and calculate the cost!
Thank you! Your message has been sent. We will be in touch shortly.
Something went wrong. Please check your internet connection or the data you entered.
Why trust BPA with your BI project?
One version of the truth for the entire company
Stop wasting time arguing over whose report is correct. A BI system aggregates metrics using consistent rules, ensuring that management and departments are all working from a single source of truth.
A real-time view of your business
There is no need to wait for staff to prepare the next report. Management dashboards update automatically, giving you a clear view of what is happening in your business right now.
From metric to root cause in a click
If a result changes, you won't have to manually sift through multiple reports. BI analytics allow you to drill down from high-level metrics to the details, helping you quickly identify exactly what influenced the outcome.
Less manual reporting
Your team will stop wasting hours on data exports, merging spreadsheets, and checking formulas. Automating reports frees employees from routine tasks, leaving more time for data analysis and driving results.
Spot deviations before they become problems
A BI system helps you spot changes in trends and deviations from targets immediately. Managers can react to situations in real time rather than analyzing the causes after the period has already ended.
A BI system that grows with your business
You can start with a few key dashboards and gradually expand your analytics. New data, metrics, and departments can be integrated into the existing system without having to rebuild the entire solution from scratch.
BI system and analytics platform development case studies
All projects
No items found.
Technology stack
BI and visualization
Apache Superset, Yandex DataLens, Qlik, Grafana, Metabase, custom web dashboards
Storage and databases
PostgreSQL, ClickHouse, Greenplum, MS SQL Server, Oracle, MySQL, MongoDB
Data integration and processing
Python, SQL, Airflow, dbt, Kafka, NiFi, REST API, message queues, and file exchange
Infrastructure
Docker, Kubernetes, Linux
Security
Role-based access control, user activity auditing, logging, secure data exchange
Backend
Python, FastAPI, Django, Node.js, Go
Frontend
React, JavaScript, TypeScript, proprietary visualization library

FAQ

We have compiled answers to the most frequently asked questions to help you quickly find the information you need about our services, processes, and terms of cooperation. For example, how to start a project with us, project timelines, and much more.

How does a BI system differ from standard reporting?
How long does it take to implement a BI system?
How much does it cost to develop a BI system?
Can forecasting and artificial intelligence be added?