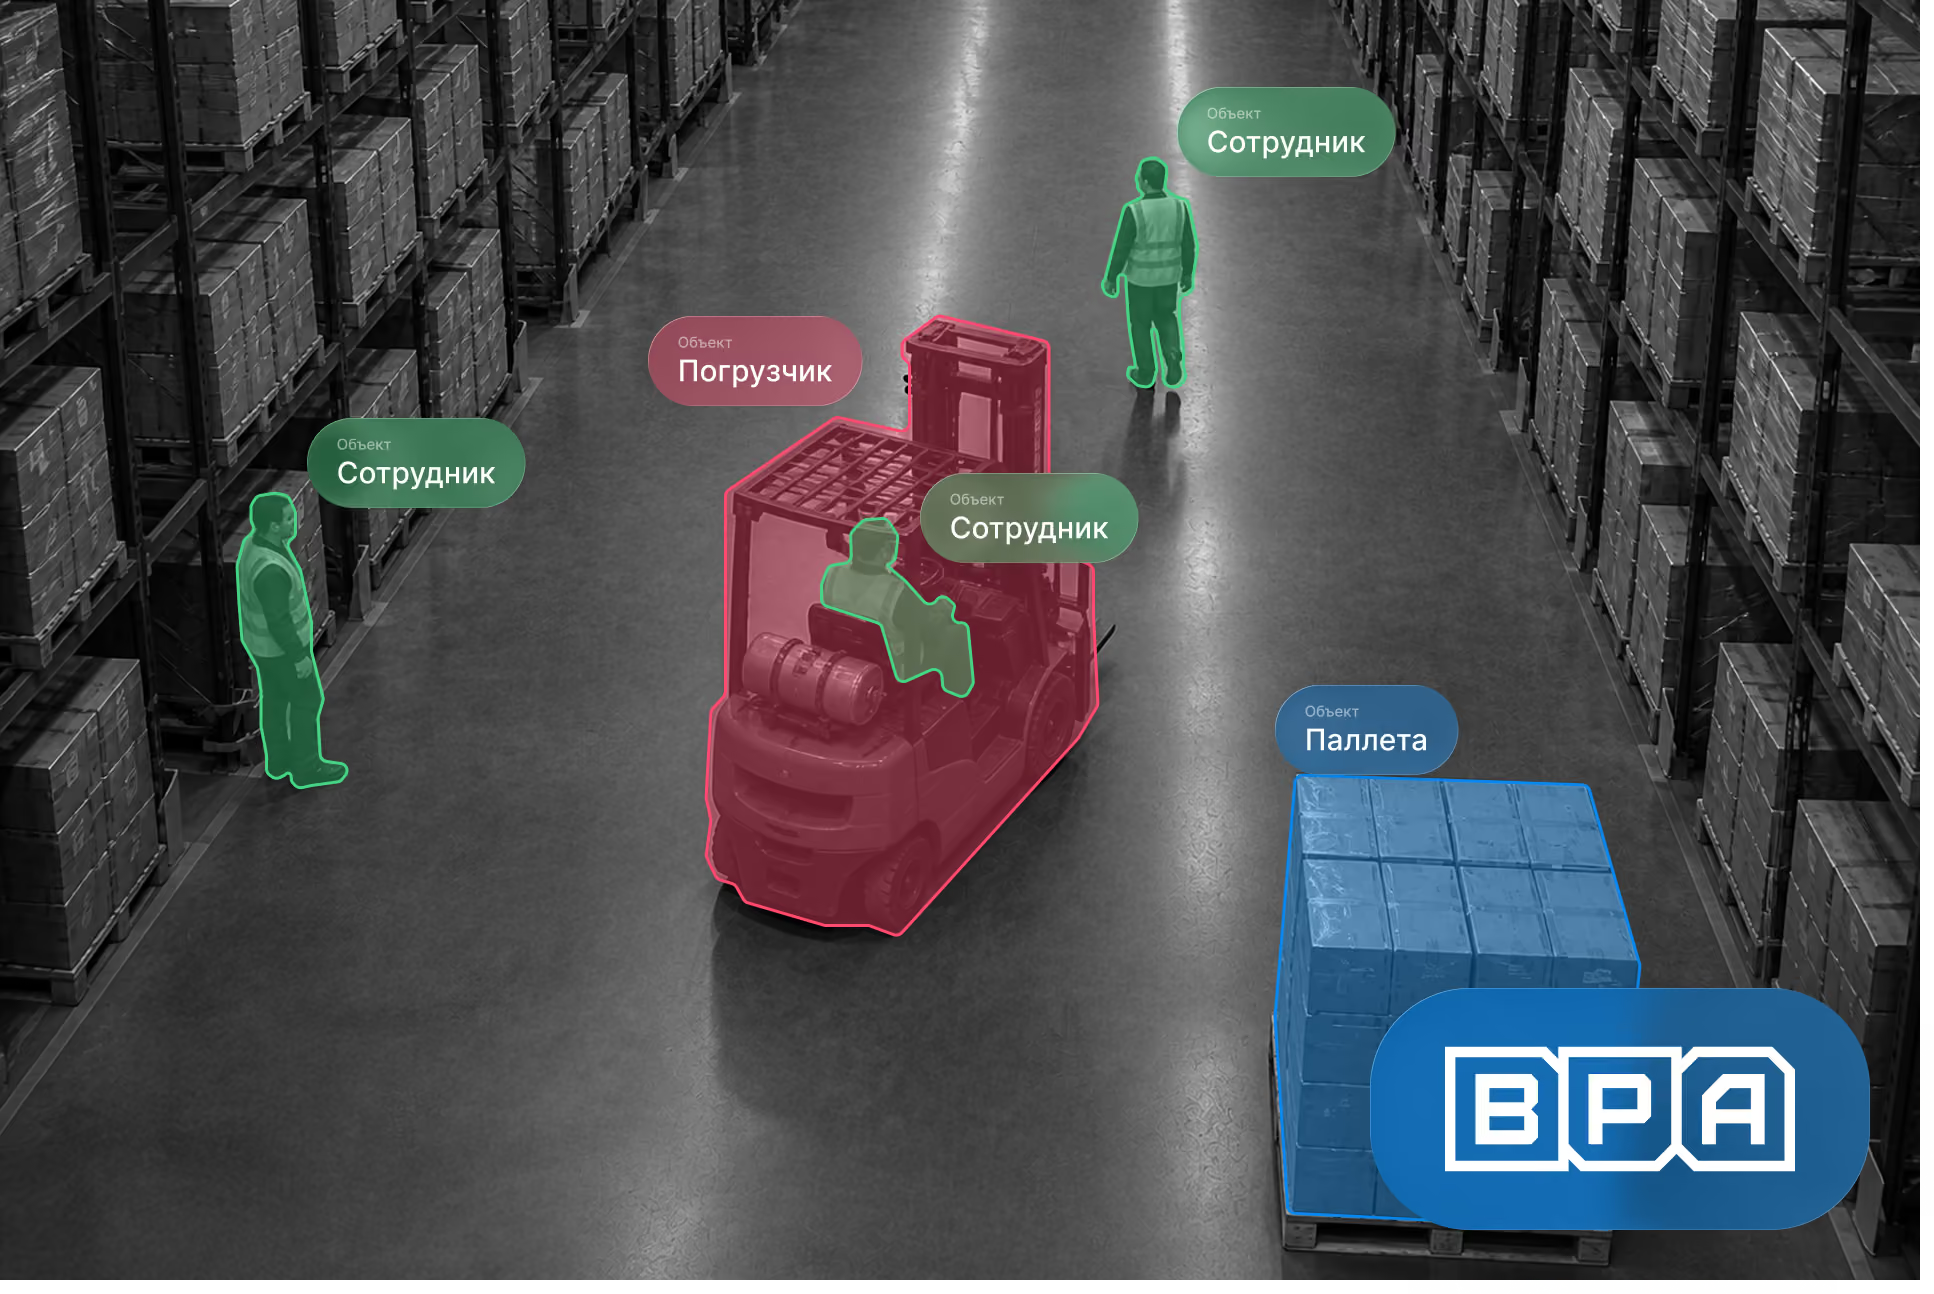

To solve this problem, a comprehensive video analytics platform was developed to monitor the main processes of the warehouse complex: truck servicing, pallet movement, storage zone occupancy, employee activity, and the use of loading equipment.
The solution is based on a computer vision module that continuously processes video streams from cameras. Neural network models identify target objects, and tracking algorithms monitor their movement between zones. The resulting coordinates, classes, and timestamps are converted into actionable business events.
The system records not just the appearance of an object in the frame, but completed or ongoing warehouse operations: a truck arriving at a specific dock, a pallet moving between zones, exceeding standard service times, forklift downtime, or a person entering a restricted area.
All events are saved in a centralized database, displayed in a web interface, and used to generate reports. As a result, AI in warehouse logistics becomes an integral part of the daily work of operators, logistics specialists, and warehouse managers.
Monitoring System Architecture
The solution is divided into several interconnected components: IP cameras, a CV module, backend, database, frontend, and integration services.
Cameras installed in loading, unloading, storage, and transit zones transmit RTSP or HTTP streams to a processing server. Computer vision systems analyze the video, detect objects, and track their movement in real time.
The server-side of the system receives events from the computer vision module, processes them according to predefined rules, and saves them in the database. It determines whether a recorded action is a standard operation, a deviation, or a potentially dangerous situation, and also ensures data exchange with 1C, WMS, and other external information systems.
The system stores the current state of the warehouse and a complete history of operations: which trucks are at the docks, where pallets are located, and which equipment is active or idle. This data is used for operational control and subsequent analysis.
All information is displayed in a unified web interface through dashboards, tables, a warehouse map, notifications, and charts. New events appear automatically, so the operator does not need to manually refresh the page.
The solution architecture is designed for scalability. When adding new cameras and zones, computing power can be increased without a complete system overhaul, while maintaining a unified interface, database, and operational logic.
Converting Video Streams into Business Events
A neural network model determines which objects are in the frame and exactly where they are located. However, for warehouse management, it is not enough to know that a camera has detected a truck, a person, or a pallet.
Therefore, a separate layer of business logic was implemented on top of the intelligent video analytics. It correlates recognition results with virtual zones, time intervals, object identifiers, and data from accounting systems.
For example, the continuous presence of a truck in a dock zone is converted into an arrival event. A prolonged lack of forklift movement becomes an idle time event. The appearance of a pallet in a new zone is registered as an internal transfer operation.
As a result, the system generates events that are easy for the user to understand:
- truck arrived at the dock;
- loading or unloading has begun;
- standard service time exceeded;
- pallet moved to a new zone;
- goods placed incorrectly;
- forklift is idling;
- person entered a restricted area;
- dangerous proximity between a person and equipment detected.
Consequently, applied video analytics does more than just record warehouse activity; it automatically identifies specific operations, deviations, and potentially hazardous situations.
Truck and Loading Dock Monitoring
A separate control zone is configured in the system for each dock. The camera detects the arrival of a truck and automatically identifies which loading bay it has pulled up to.
The arrival time, dock number, and duration of the vehicle's stay in the zone are saved in the database. If the truck's ID or license plate number is pulled from 1C or entered by an operator, the event is linked to a specific receiving or shipping order.
After arrival, the system continues to track activity around the truck. It analyzes the movement of personnel and warehouse equipment to determine when loading or unloading begins and ends.
The interface displays:
- the status of each dock;
- the truck ID or license plate number;
- arrival time;
- duration of stay;
- current service stage;
- exceeding the established standard.
If a vehicle remains in a dock longer than the allowed time, the system generates an alert for the logistics manager or operator. Transaction history is used to calculate average loading and unloading times, dock utilization, and the number of delays.
This monitoring allows for the identification of bottlenecks and the evaluation of loading zone performance based on actual time metrics.
Tracking pallet and goods movement
The system recognizes pallets in receiving, shipping, and storage areas, as well as in main warehouse aisles. Logical zones corresponding to the physical areas of the facility are defined for each camera.
When a pallet moves through the warehouse, the computer vision system automatically determines which zone it was moved from and to, saving the operation time along with cargo data. QR codes or ArUco markers are used to identify specific pallets; these are read from the video stream or at a dedicated checkpoint equipped with a high-resolution camera.
Once the identifier is recognized, the system retrieves information from 1C regarding the product, batch, order, planned location, and responsible personnel.
The actual operation is compared against the inventory task. If a pallet is supposed to be directed to one rack but the machine vision system detects it in a different zone, a discrepancy is recorded.
This allows for the integration of warehouse accounting with the physical movement of goods, reducing the number of unregistered or erroneous movements.
Rack and storage bin monitoring
Occupancy monitoring for racks and individual storage bins is implemented for storage areas.
The system compares the current image of a section with its previous state to determine where an object has appeared or disappeared. By calibrating the image against the rack structure, pallet coordinates are linked to the row, level, and specific bin number.
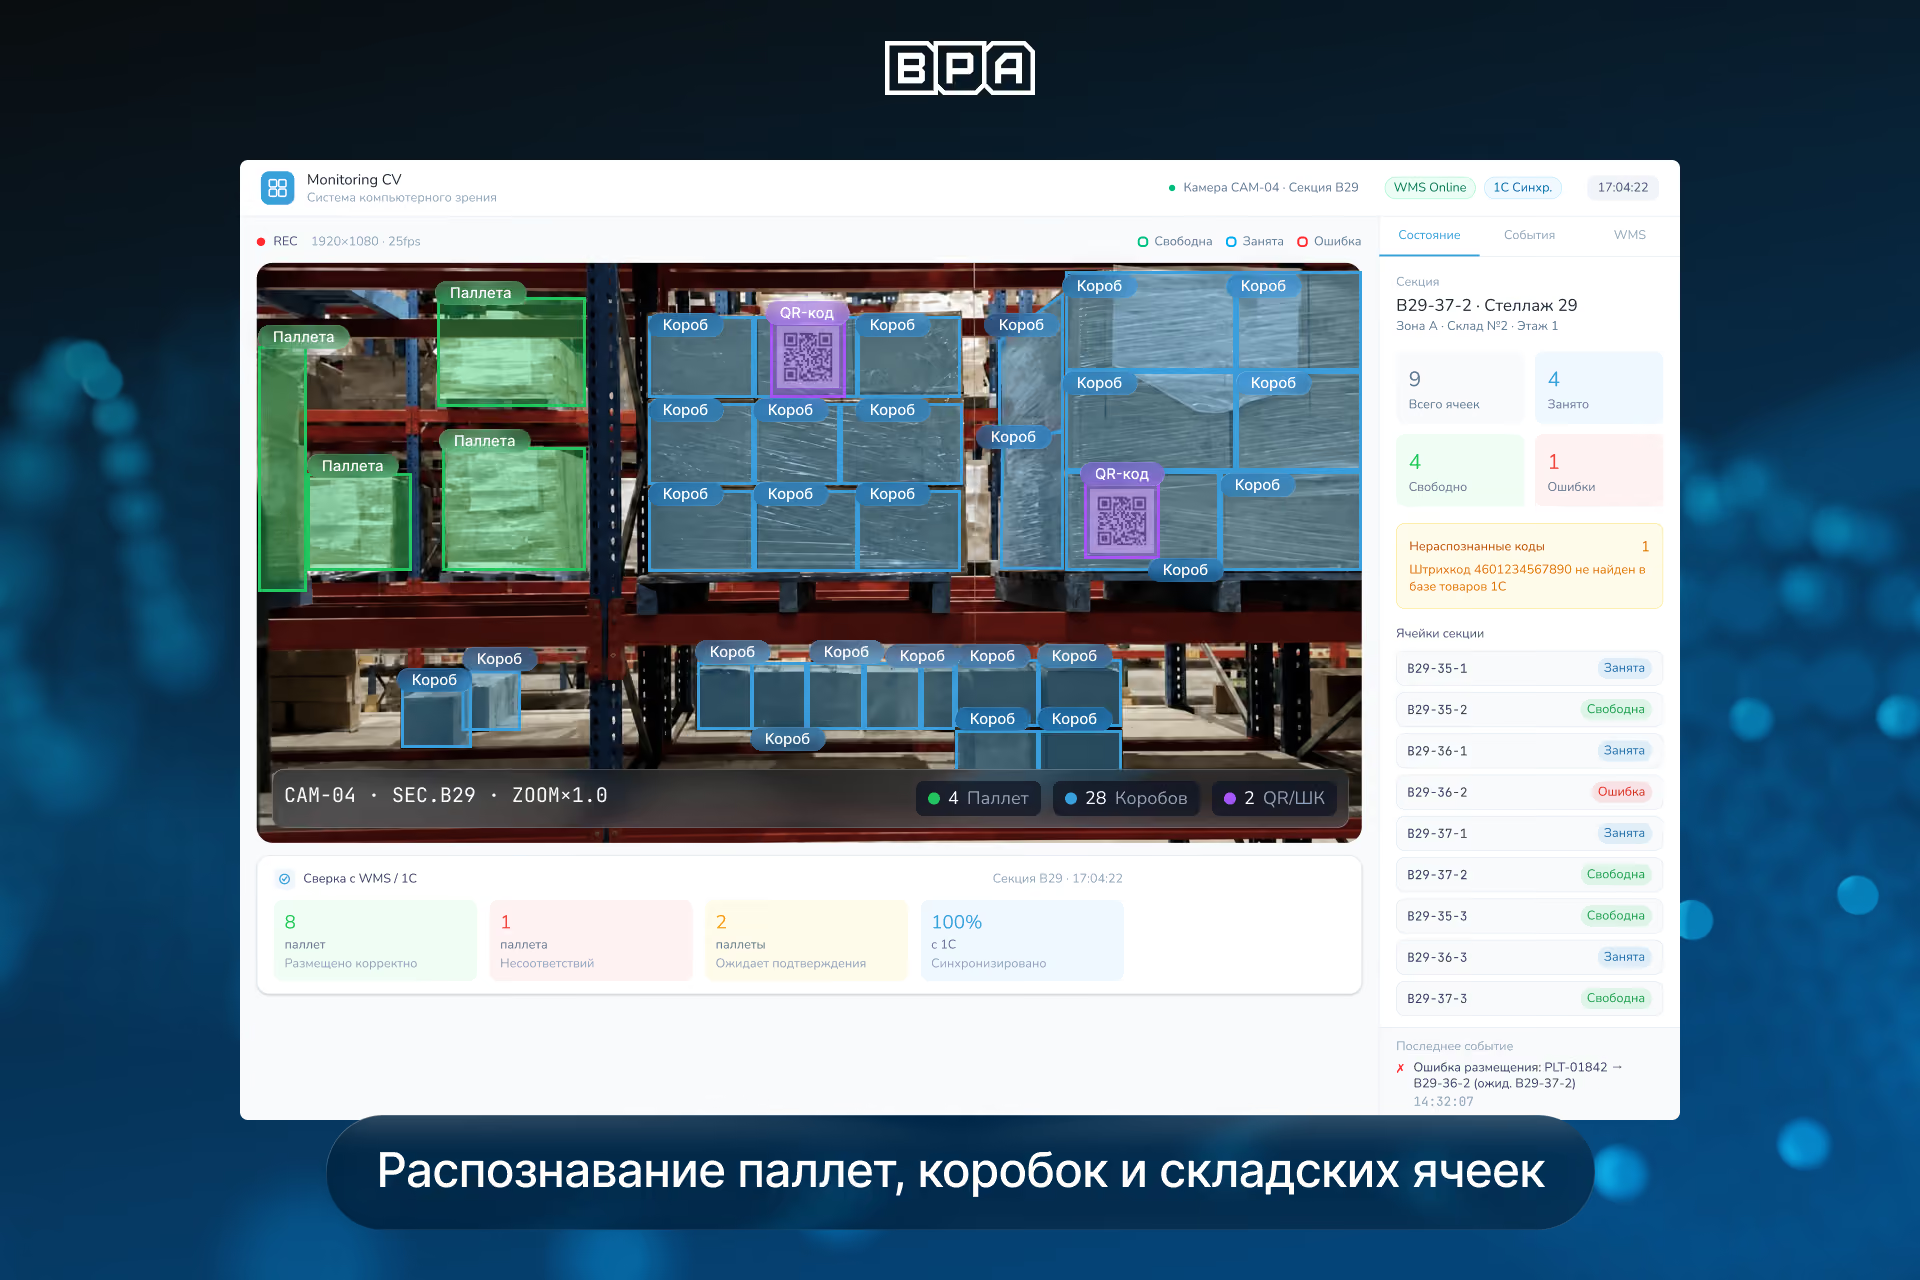
A combined scenario is also supported: an employee confirms the placement location via a terminal or scanner, while video analytics verifies whether the pallet was actually placed in the specified bin.
The web application generates a warehouse map displaying occupied and vacant positions, the number of pallets by zone, and the last recorded movement.
For each pallet, you can open the operation history to view:
- where it was moved from and to;
- when the operation was performed;
- which bin it is currently in;
- which product or order it corresponds to;
- whether the actual location matches the recorded one.
Identifying stagnant pallets
The database stores the date and time of the last movement for each pallet. Acceptable idle periods are set for specific zones and product categories.
If a pallet remains in the same spot longer than the set limit, it is automatically flagged as "stagnant." This information is compiled into a separate report, and a notification is sent to the responsible employee.
Periodic video inventory allows for additional verification of actual rack occupancy against system data. This is how warehouse analytics helps identify stagnant stock, placement errors, outdated inventory, and storage locations that do not match the records in the management system.
Personnel monitoring
The CV module detects people and calculates their count in monitored zones. The primary focus is on loading docks, traffic aisles, and areas where personnel interact with moving equipment.
For each zone, the system records the number of people, entry and exit times, total duration of stay, and any instances where the occupancy limit is exceeded.
The system also registers when a person enters a restricted or hazardous area, as well as personnel presence during off-hours. If a violation is detected, an alert is triggered. Facial recognition is not used; monitoring is based on non-biometric detection and human tracking.
The accumulated data allows for the analysis of area utilization and employee routes. Managers can see where staff spend the most time, which zones regularly experience bottlenecks, and how evenly the workload is distributed.
Warehouse equipment monitoring
The model recognizes forklifts, stackers, pallet jacks, and other types of warehouse equipment. For each unit, the system determines its current location and the sequence of movements between zones.
Tracking algorithms distinguish between active work and downtime. If a piece of equipment remains stationary for longer than a specified interval, the system creates an event and includes it in the final statistics.
The interface displays the location, status, and current activity of each forklift. The following metrics are calculated per shift:
- active operating time;
- downtime duration;
- number of transport operations;
- workload distribution;
- utilization rate;
- time spent in specific zones.
This data helps determine whether the warehouse is truly short on equipment or if the existing fleet is being used inefficiently due to uncoordinated tasks and idle time.
Proximity detection
The system analyzes the relative positions of people, forklifts, and other moving objects.

If a forklift approaches a person or another piece of equipment within an unsafe distance, a potential risk event is recorded. The operator receives a notification in the web interface, and if a Telegram bot is connected, a message is sent to the responsible employee.
To reduce false positives, the system considers not only the distance between objects but also their position relative to specific zones, their direction of movement, and the duration of the proximity.
In this way, the implementation of video analytics complements existing safety measures by providing objective logging of potential incidents.
Dataset preparation and model training
To power the solution, a specialized dataset was prepared that reflects real-world warehouse conditions.
Images and video sequences were annotated using bounding boxes, segmentation, and other labeling methods. The dataset includes various zones, camera angles, lighting conditions, and complex scenes with partial occlusions.
Special attention is paid to frames where a pallet is on the forklift forks, a person is partially obscured by cargo, or multiple pieces of equipment are moving in close proximity.
At least 6,000 images are provided for each base class. Computer vision models are fine-tuned using data from the specific facility.
Recognition quality was evaluated using Precision, Recall, and mAP metrics. This approach allowed us to adapt computer vision technologies to the actual warehouse geometry, camera placement, and object movement patterns. Consequently, recognition is supplemented by DeepSORT algorithms, multi-camera tracking, and ReID. Each detected object is assigned a temporary ID that is maintained across consecutive frames.
When working with multiple cameras, events are consolidated on the server side, taking into account timestamps, zones, and identifiers.
Integration with 1C and WMS
One of the key components of the project is the development of integrations with corporate management systems.
The system receives information from 1C and WMS regarding expected deliveries, trucks, orders, pallets, items, batches, and planned movements.
Video analytics confirm the actual execution of operations. Once a vehicle arrives, a pallet is placed, or a movement is completed, the corresponding event is transmitted back to the accounting system.
If an operation does not match the plan, a discrepancy is created. For example, the system can detect that a pallet has been moved to a different zone or that a truck is being serviced significantly longer than the allotted time.
Integration with the Chestny ZNAK system
After scanning the code, the system retrieves information about the labeled product and batch, linking them to a specific pallet movement. The code is verified, and data on the completed operation is then transmitted to 1C and, if necessary, to the Chestny ZNAK system.
As a result, a complete sequence of the operation is preserved:
code scanned → product identified → operation verified → movement recorded → data updated in the accounting system.
This integration of information systems reduces manual data entry and ensures the traceability of labeled goods.
Centralized web interface
Web applications accessible via browser have been developed for operators, logistics specialists, and managers. The main screen is a warehouse dashboard displaying dock occupancy, active trucks, the number of pallets by zone, equipment status, staff workload, and current alerts.
Data is updated via WebSocket, so events appear in the interface almost immediately after they are recorded.
A separate log contains the history of all operations. Users can filter records by date, object, zone, event type, or severity level.
For any specific truck, pallet, or piece of equipment, you can open a card to reconstruct the full sequence of events.
The developed management dashboard combines operational control with accumulated statistics:
- For trucks, the system calculates average service time, dock utilization, the number of delays, and the percentage of operations exceeding standard times.
- For pallets, it displays movement history, zone occupancy, stagnant inventory, and discrepancies with accounting data.
- For personnel, it analyzes the number of people in zones, duration of stay, and workload distribution.
- For equipment, it calculates active time, downtime, number of transport tasks, and utilization efficiency.
Automated reporting reduces reliance on manual summaries and provides management with up-to-date data for every shift, day, or selected period.
Moving forward, the accumulated information is used to optimize warehouse operations and technologies: adjusting standards, reallocating resources, changing routes, and eliminating recurring delays.